Strategy on verge of golden cross, just weeks after bitcoin flashed same bullish signal
Your day-ahead look for Oct. 19, 2026
This is an excerpt from CoinDesk newsletter 'Daybook.' Sign up here, if you haven't already.
Weeks after bitcoin’s (BTC) price chart flashed a major bullish signal, Strategy (MSTR), the largest publicly listed accumulator of the cryptocurrency, is about to do the same.
The signal, a golden cross, occurs when a security’s 50-day average price rises above its 200-day average. Some traders read the transition as a decisive bullish shift in momentum that can lead to a prolonged rally.
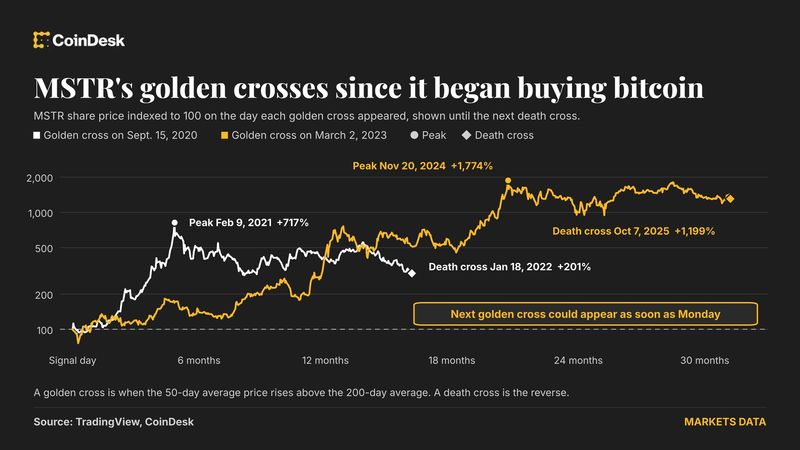
For MSTR, which holds $69.81 billion in bitcoin, the cross could happen as soon as Monday. Since the company began buying the largest cryptocurrency for its balance sheet in August 2020, the stock has had two such crosses, and huge rallies followed both.
The first happened on Sept. 15, 2020, with the stock at about $15.57. MSTR climbed to $127.29 by February 2021, a gain of 717%. A death cross, the opposite of golden cross, followed in January 2022. By then, the stock was at $46.83, still triple the value on the day the bullish signal first appeared.
The second came on March 2, 2023, at $25.29. The shares peaked at $473.83 in November 2024, up 1,774%. When the death cross arrived in October 2025, MSTR was at $328.40, still 1,199% higher.
It’s worth keeping in mind that the signal isn’t especially reliable. In MSTR’s case, since 1999, the shares have registered 19 golden crosses. On 11 occasions, the stock was higher three months later, and after only 10 was it higher 12 months later, according to data analyzed by CoinDesk.
That’s a record of 50% accuracy. The median 12-month return was just 3.3%, and the two worst crosses, in 2001 and 2007, were followed by a 61% loss.
Since bitcoin confirmed its golden cross on Sept. 8, it has risen by nearly 5% to $82,000, extending the rally from July lows under $60,000. The price hit a high of over $87,000 early this month.
Read more: For analysis of today's activity in altcoins and derivatives, see Crypto Markets Today . For a comprehensive list of events this week, see CoinDesk's "Crypto Week Ahead."
The chart shows MSTR’s daily price swings in candlestick format since February 2025. The chart overlays 50- and 200-day moving averages in yellow and green, respectively.
The 50-day average looks set to cross above its longer-term counterpart, confirming a golden cross. This follows a trendline breakout, another bullish development, and suggests potential for further price gains.
Diversified RWA stablecoins sustain 5-7% yield from real credit as crypto funding compresses to ~4%. GENIUS pushes yield off-chain; TAM grows to $4B in 3 years.
Asanat Analysis — Why it matters
A golden cross—where a 50-day moving average crosses above the 200-day moving average—is a widely-watched technical reversal signal that often precedes sustained rallies in momentum-sensitive assets. Bitcoin's recent golden cross has historically preceded multi-month uptrends, though its predictive power varies significantly across market regimes. The repetition of this pattern across multiple assets within weeks suggests either broad-based momentum accumulation or heightened retail/algorithmic attention to the same technical levels.
The clustering of golden crosses across different strategies (likely index funds, trading desks, or derivative positions) is noteworthy because it can become self-fulfilling: positioned traders expecting upside may size in aggressively once confirmation appears, creating the very momentum the signal predicts. However, in mature markets, consensus technical signals often arrive after institutional accumulation has already occurred, meaning late participants may be chasing entry. The timing—months into a potential macro cycle—matters more than the pattern alone for assessing sustainability.